
I believe the future in football analysis is converting the things we see on the field on a routine basis into consumable data.
I’m attempting to do just that for running backs.
Before I get started, I want to give Matt Harmon a huge shout out for his Reception Perception process which gave me the idea to start charting running backs. Harmon is a true pioneer in football analysis and without him paving the way with Reception Perception, I definitely would have never thought to try my hand at this.
Alright, here is a quick background on my general feel of the position: I find watching running backs to be very fluid. I know “fluid” may seem like an odd word usage, but first consider everything that has to go right for a running play to be successful. Initially, the quarterback-running back exchange has to go as designed. Next, the offensive line has to “do their job” and correctly execute the blocking scheme. Then, the back has to choose the right hole, get to the second level, make someone miss, just to gain extra yardage.
Running the ball clearly isn’t as binary as passing. Multiple variables have to go according to plan for a run to be successful. The same is somewhat true with passing, but more variables — most notably blocking — are simply out of the control of the running back on a routine basis.
All of this is to say: it’s extremely hard to divorce running back play and outside variables from one another using a statistic like yards per carry (YPC). This process that I’m attempting to create doesn’t fully separate offensive line play from running back skill, but it is certainly a data point that needs significantly more work in the football analysis community. Hopefully this process will eventually clear some of the fog.
Thanks to the awesome guys who edit cut-ups on Draftbreakdown, my goal with the 2016 draft prospects is to chart a total of five games (preferably two good games, two bad ones and one mediocre game) with all of the prospects. Since the college season ranges anywhere from 11-13 games played, charting a total of five games should represent just under half to 40% of games played during the season.
Yards Blocked and Yards Created Explanation
The purpose of the creation and need for Yards Blocked and Yards Created is simple: a running back is highly dependent on offensive line play. The thing is, there aren’t many fantastic mechanisms to parse out how much of the success — or the failure — of a play is on a running back’s shoulders. Yards before contact does a decent job of this (i.e. the average amount of yards gained before a back is touched) but it does a poor job of indicating one main point: was the yardage before contact gained because, 1. the offensive line did an exceptional job blocking? or, 2. did the running back “create” the yards for himself?
That’s the line I’m attempting to clear.
So Yards Blocked, as we’ll call it, is the amount of yards the offensive line creates for a running back. I grant you that this can fluctuate greatly — a guard can pull through the gap eight yards up field or get completely blow back three yards behind the line of scrimmage. The typical range of outcomes that happen on a given run play varies greatly. Still, everything that happens after what is blocked is the running back’s responsibility and everything before is largely out of the running backs control.
Here’s an example of what I’m referring to:
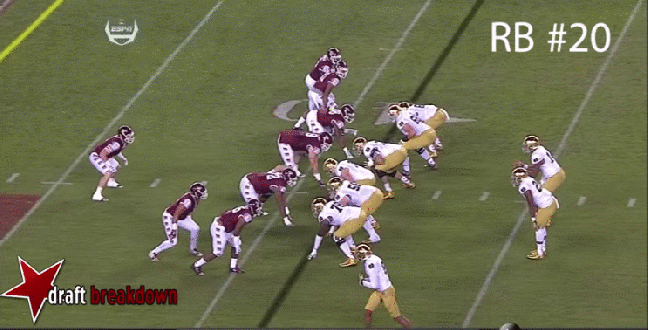
On this play versus Temple, the defense immediately blows up the play at the point of attack while the offensive line left a free blitzer unblocked on the outside. The right tackle gets beat quickly, leaving the blocking scheme in shambles. I charted this specific play as -4 yards blocked and the result of the play (a four yard loss) was not C.J. Prosise’s fault.
Yards Created is a little less ambiguous. Here, I just want to know what happens after the offensive line has or has not done their job.
A running back can create his yards after blocking a myriad of ways. Be it through speed, power or elusiveness, a running back’s vision is something extremely hard to quantify.
Let’s go through a Yards Created example.

In the GIF above, the blocking is a bit messy and there are Massachusetts defenders in the backfield almost immediately. The pulling Notre Dame right tackle executes his block on the defensive end (creating two yards blocked) and Prosise explodes through the crease. In this instance, Prosise “creates” 55 yards rushing and forced two missed tackles with speed making the crashing safety miss and blowing past the Massachusetts cornerback (No. 1).
Since this process measures what is taking place snap-by-snap, the goal is to actually minimize the cognitive biases we humans have when we see plays like the one in the video above. We have a natural tendency to latch on to either positive or negative events strongly, and the routine, non-flashy events — like a three yard gain — are rarely remembered. The main goal of “Yards Created” is to measure what happens on every down and give equal importance to positive, negative and routine events.
Alright, now the fun stuff. I promise.
C.J. Prosise isn’t as “sexy” of a prospect as Ezekiel Elliott, but that’s not the point. I found Prosise to be incredibly intriguing before I even thought about attempting to create this process. An absurd 23.6% of Prosise’s 2015 carries went for 10-plus yards, which was miles above the 2016 class average (15.03%) and the best in the class (of 15 prospects in the sample). Naturally, he’s my starting point.
Games Sampled
| Games | ruATT | ruYds | YPC | ruTDs | Rec | ReYds | Y/R | reTDs |
|---|---|---|---|---|---|---|---|---|
| GT | 22 | 198 | 9 | 3 | 1 | 5 | 5 | 0 |
| UMass | 15 | 149 | 9.9 | 2 | 0 | 0 | 0 | 0 |
| USC | 19 | 143 | 7.5 | 2 | 5 | 32 | 6.4 | 0 |
| CLEM | 15 | 50 | 3.3 | 0 | 4 | 100 | 25 | 1 |
| Temple | 14 | 25 | 1.8 | 0 | 5 | 43 | 8.6 | 0 |
Everything else from this point on is charted data from the above five game sample.
C.J. Prosise’s Yards Blocked and Yards Created
| Per Att. Data | Yards Blocked/Att. | Yards Created/Att. |
|---|---|---|
| Total Attempts: 84 | 1.26 | 4.90 |
Objectively, because this process is still very new, I don’t have much to compare this data to. Notre Dame’s offensive line was pretty fantastic in 2015 and Prosise certainly benefited from an incredibly deep rotation at the position. In the five game sample, the Notre Dame offensive line allowed just 20 runs (of 85) that had negative yards blocked. Nine of those 20 negative plays were just for negative one yard blocked.
Furthermore, FootballOutsiders Adjusted Line Yards metric pegged the Irish as the second-best offensive line in the country in 2015.
Prosise certainly benefited from stellar offensive line play in 2015, but as you will continue to read below, he was electric and a masterful creator for a converted wide receiver playing his first ever season at running back.
Run Type Data
| Inside% | Outside% | Counter% | Toss% | Other% |
|---|---|---|---|---|
| 52.38% | 34.52% | 3.57% | 2.38% | 3.57% |
Notre Dame’s 2015 offense predicated on inside and outside zone-read concepts out of shotgun and Prosise was very comfortable running off-tackle.
Prosise was actually more productive on outside runs, creating 5.36 yards per attempt on such carries versus 3.71 yards created per attempt on inside runs. The difference can be partly attributed to offensive tackle Ronnie Stanley — who is considered a 1st round draft prospect in 2016.
Notre Dame’s offensive line as a whole was better running to the outside in the five sampled game’s as well. I charted the Irish line with an average 1.37 yards blocked on outside runs versus 0.88 yards blocked on inside runs.
Even though he didn’t carry the ball 289 times like Ezekiel Elliott, Prosise was very productive and efficient on his carries in 2015. The thing is, I’m not sure he should be “knocked” as a prospect because he ran behind a great offensive line and one of the best offensive tackle’s in the country. It’s not like just any running back could average 102.9 rushing yards per-game, have the long speed to rip off 20-plus yard runs on 7.01% of his carries (highest of the 2016 prospects) and force missed tackles.
Missed Tackles Forced (Rushing)
| MT Power/Att. | MT Elusiveness/Att. | MT Speed/Att. |
|---|---|---|
| 0.18 | 0.12 | 0.11 |
And here are C.J. Prosise’s missed tackles forced receiving on a per target and opportunity (targets plus carries) basis:
Missed Tackles Forced (Receiving) and Missed Tackles Forced Per Opportunity
| MT/Target & Opp | MT Power/Tgt | MT Elusive/Tgt | MT Speed/Tgt | MT/Opp. |
|---|---|---|---|---|
| Targets: 17 | 0 | 0.18 | 0.12 | 0.386 |
One of the greatest strengths in Prosise’s game is his sheer power as a runner. His 87th percentile weight-adjusted Speed Score gives him excessive strength on his 220lbs frame and perfectly coincides with the amount of times he finished runs aggressively with force and burst.
Prosise forced a missed tackle through power on 18% of his carries in this five game sample and forced a defender to miss on 38.6% of his total opportunities (rush attempts and targets).
The one major qualm some have about C.J. Prosise is his agility. He posted a three cone time at his 2016 pro day that was in the 15th percentile for all qualifying NFL running backs since 1999. It’s not a complete landmine, but it is one of the weaknesses Prosise has a runner. Again, I will only be able to compare Prosise’s missed tackles forced by elusiveness numbers once I have a larger sample.
Route/Target Data plus Average Depth of Target
| Route/Target Data | Routes/G | Targets/G | aDOT |
|---|---|---|---|
| Total Targets: 17 | 13.6 | 3.4 | 5.0 |
And here is where Prosise ran his routes from:
| Total Routes | Backfield Route% | Split Wide% |
|---|---|---|
| 68 | 77.94% | 22.06% |
In terms of NFL project-ability, Prosise’s biggest selling point is his passing game chops. Not only can he run screens, check-and-releases, dart routes and wheel routes out of the backfield, he can move out wide into the slot with ease.
Not totally dislike Arizona Cardinals running back David Johnson, C.J. Prosise’s experience as a former wide receiver actually works for him instead of against him. He can immediately become an asset on passing down’s on an NFL squad and showed more than enough as a runner to eventually work on all three downs.
If a team is looking for a back not named Ezekiel Elliott that has a diverse enough game to become a three down back in the future, Prosise could be the remedy.
Pass Protection
| Pass Pro Att. | Pass Pro Execution % |
|---|---|
| 28 | 75.0% |
Finally, we get to the skill that the majority of NFL-ready backs need work on: protecting the quarterback. Since I don’t have a large enough sample yet, I can’t make any objective comparison’s for how Prosise checks out in pass protection relative to other backs in the class.
However, I do think the fact he was asked to pass block 5.6 times per-game at Notre Dame and executed his assignment more than seven out of ten times only bodes well for a first year running back.
C.J. Prosise Is Not Just a Complimentary Back
Due to his skill set in the pass game and his clear ability to run the ball with power and speed, C.J. Prosise sets up very well to be a future fantasy football asset. He’s currently going at the end of the first round in Dynasty rookie drafts and is one spot behind fellow Irishman Will Fuller in DynastyLeagueFootball’s April average draft position.
Landing spot will be important as it always is for running backs, but if given the opportunity to work as more than just a passing down back, the 21-year-old Prosise could be a steal in all 2016 fantasy drafts. The NFL will decide on his future soon enough.

I really like your approach here. I was thinking that long runs are going to skew numbers unfairly, based on the position the play starts at on the field. A break away run at your own 20 has 80 yds in which to create yards, while the same play could be equally as good but because it started at the opponent 20 it only goes for 20 yards. Is that something you’ve already accounted for? Perhaps with capping the max yards created per attempt, or using a trimmed mean (tossing out results +- 2 or 3 std dev from mean)?
LikeLike
Hey, Jason. Thanks for reading and the feedback. I have thought about that, but I think that limiting yards created may lead to some statistical flaws. I’m not discounting poor runs nor am I normalizing long ones. Yards/carry is prone to outliers (yards created is too) but the goal of YC is to actually smooth out some of the outliers naturally. By giving the context of team yards blocked and yards created, I’m hoping to naturally smooth the variance involved. YC is not perfect, but I think normalizing runs may lead to more harm than good (and thus harm the analysis).
LikeLike
Thanks for the Reply.
I see your point, and with anything football nothing is ever going to be perfect. Especially when trying to quantify an individuals contribution in a team sport. Maybe I’m off here, but it seems like “grinders” would benefit more from normalized data, while “Home Run Hitters” would benefit more from pure data.
I’m curious, have you calculated the Std Deviation? It might be worth publishing as an additional data point, help give a little more context to the analysis, and on a strictly nerdy personal note, it would give me a chance to see the confidence level 😀
LikeLike
I like where your head is at, Jason. I will give it some thought.
LikeLike